Steering-by-Example for Progressive Visual Analytics
ACM Transactions on Intelligent Systems and Technology, 2022
Authors
Marius Hogräfer Marco Angelini Giuseppe Santucci Hans-Jörg Schulz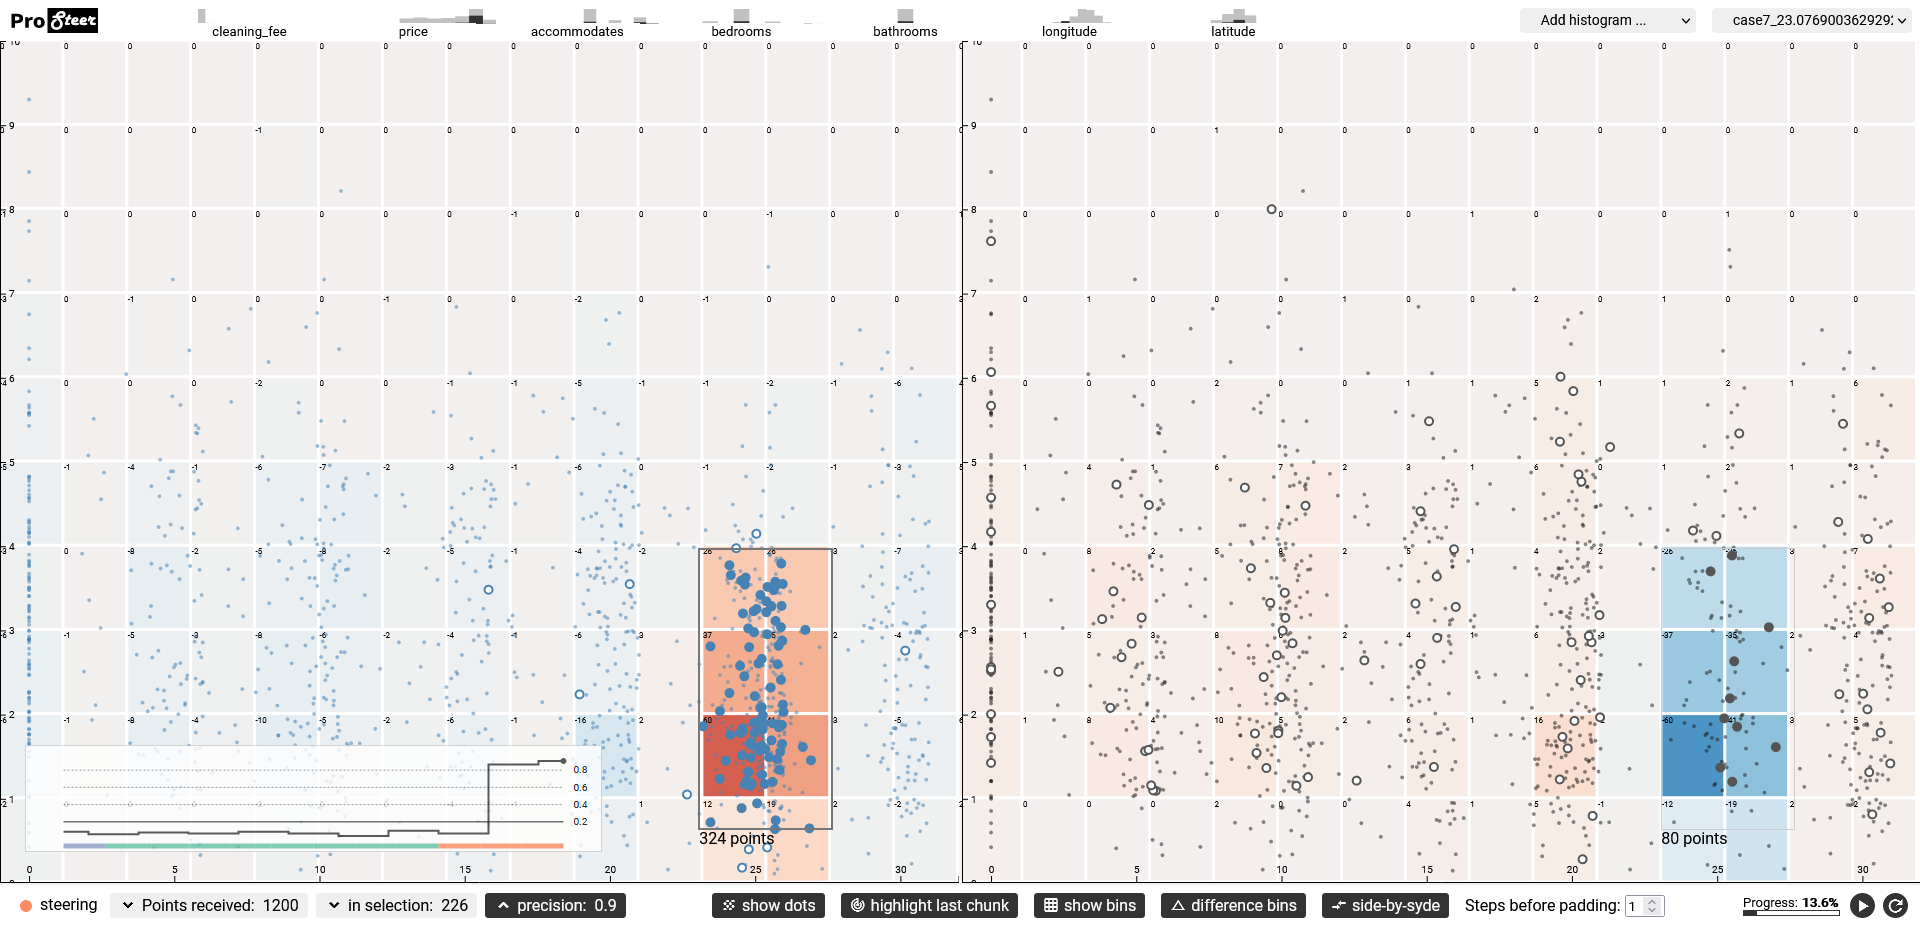
Abstract
Progressive visual analytics allows users to interact with early, partial results of long-running computations on large datasets. In this context, computational steering is often brought up as a means to prioritize the progressive computation. This is meant to focus computational resources on data subspaces of interest, so as to ensure their computation is completed before all others. Yet, current approaches to select a region of the view space and then to prioritize its corresponding data subspace either require a 1-to-1 mapping between view and data space, or they need to establish and maintain computationally costly index structures to trace complex mappings between view and data space.
We present steering-by-example, a novel interactive steering approach for progressive visual analytics, which allows prioritizing data subspaces for the progression by generating a relaxed query from a set of selected data items. Our approach works independently of the particular visualization technique and without additional index structures. First benchmark results show that steering-by-example considerably improves Precision and Recall for prioritizing unprocessed data for a selected view region, clearly outperforming random uniform sampling.
Citation in BibTeX
To cite this article, we encourage you to use the following bibtex entry in your citation manager:
  @Article{Hograefer2022steer,
    title = {Steering-by-example for {P}rogressive {V}isual {A}nalytics},
    author = {Hogr\"{a}fer, Marius and Angelini, Marco and Santucci, Giuseppe and Schulz, Hans-J\"{o}rg},
    volume = {13},
    number = {6},
    issn = {2157-6904},
    doi = {10.1145/3531229},
    journal = {ACM Transactions on Intelligent Systems and Technology},
    year = {2022},
    pages = {96:1--96:26}
  }
ProSteer: An Experimental Visual Environment for Steering-by-Example
Contents
Scenario
We introduced the steering-by-example approach for progressive computations, for which their complexity prohibits running multiple passes over the entire dataset as it would simply take too long. This could either be due to the size of the dataset being too large, or the computations run on the dataset taking too long. As a realistic scenario for our benchmarks, we describe an example of the latter case, in which a business traveler uses steering-by-example while looking for a suitable accommodation in the city of Paris to attend a conference.
To determine, whether a housing listing is suitable or not, the traveler requires it to lie within walking distance to the conference venue, while at the same time having a reasonable price compared to its neighborhood. There are thus two key performance indicators to this scenario on which the traveler bases her decision: the distance to walk to the conference center and the price in relation to other accommodations lying in a predefined radius of, e.g., 300 meters around a housing offer. The former indicator can be computed using standard routing algorithms for the distance on foot between the conference venue and a particular housing option (e.g., the Google Distance Matrix service), while the latter indicator can be computed through a range analysis on the geographic location and housing price dimensions. This traveler interest can only be computed on-demand, as it relies on the conference location for the former and on the travel dates for the latter. Yet, as the dataset contains tens of thousands of housing listings, these on-demand computations also take some time to complete.
After the system has processed about 10% of the data, the traveler detects a cluster of housing listings that lie within a generally acceptable distance and offer good prices for their neighborhood.
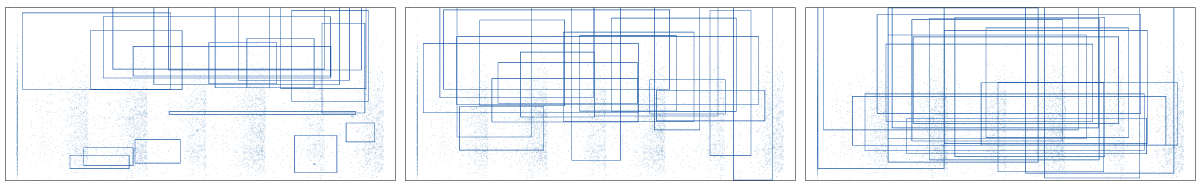
Using steering-by-example, the traveler informs the PVA system to prioritize listings for that same visual cluster during the computation, by selecting it in the visualization through direct manipulation. She observes how the next listings that are retrieved all fall within or in close proximity to the cluster she selected (see Fig. 1). After finding a listing that she particularly likes, the traveler decides to go forth and book that housing option. In total, she only needed to wait up until ca. 20% of the data was processed, because she could focus on a particular subspace early on once she noticed a particular pattern forming.
Architecture
Here we give a high-level overview of the architecture of our steering-by-example implementation.
The main goal of our implementation is to be able to qualitatively and quantitatively evaluate the steering-by-example approach. In the context of the scenario outlined above, the central task throughout our evaluations is to determine how much quicker the interesting listings from the dataset that are located inside the region the user indicated are shown to her when using the steering-by-example approach. More abstractly, our goal is to compare the overall precision (percentage of retrieved data items that were located inside the selection compared to those outside the selection) and recall (percentage of all already retrieved data items that were located inside the selection compared to all items from the dataset that will eventually be located inside the selection) with regards to the selection in view space for steering-by-example compared to a baseline of uniform random sampling and a hypothetical perfect predictor. Perfect predictor here refers to a perfect oracle, i.e. a retrieval approach that has constant precision=1.0 and recall=1.0 for every user selection at every data chunk. We compare approaches from multiple perspectives, for instance comparing how many data items land inside versus outside the selection at a certain chunk, comparing how steering affects the data in view space at one time point of the progression versus another, or comparing the data distribution inside the selection versus outside.
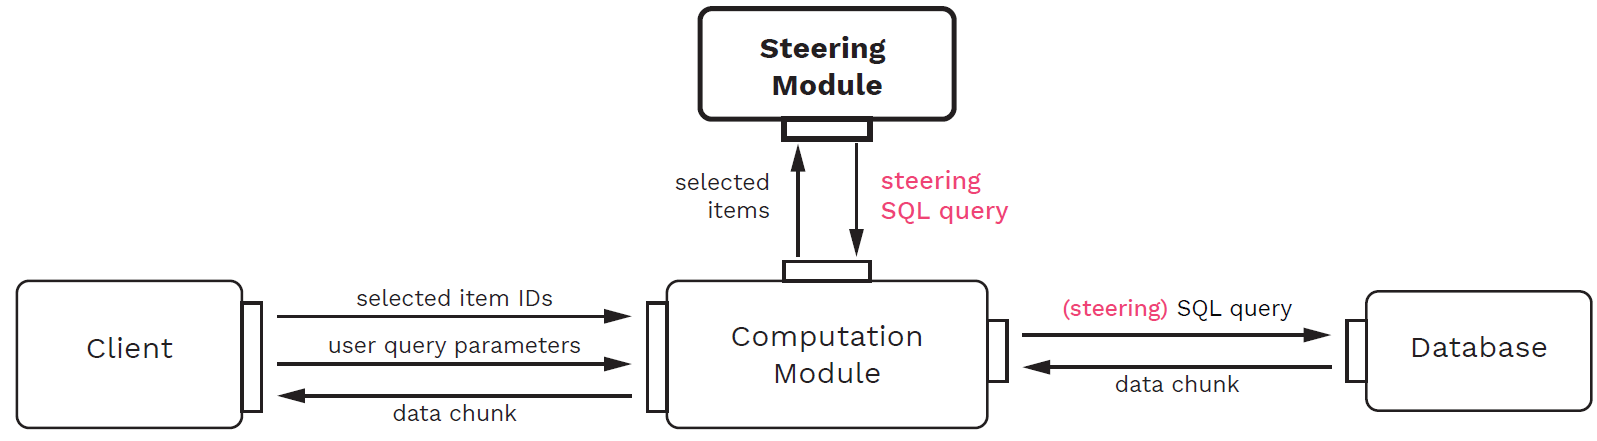
To be able to make these comparisons, we structured the implementation along a basic pipeline reflecting the scenario, where data is loaded from a database, processed by a computation, and then shown in a visualization, on which view space selections can be made to define a region of interest. The four modules listed below that make up that pipeline are depicted in Fig. 2.
- The client, which provides the user interface for visualizing and interacting with the progression. Using this module, one can assess the progression through a set of visualizations, monitor the performance of the steering-by-example algorithm, and define a region of interest through direct selection.
- The database, which holds a dataset and returns it in chunks in response to relational queries.
- The computation module, which runs the analytic computation on the data. This module sits between the other modules and mediates messages between them.
- The steering module, which implements the steering-by-example algorithm and thus takes a set of data items from the selected view region and produces an SQL query for prioritizing their respective data subspace.
The benefit of using this modular architecture is that we can exchange individual functionalities and evaluate them before and after this exchange. We can for example compare a steering module that implements steering-by-example to a steering module that only relies on random uniform sampling and never returns a steering query. We can compare the two versions with regards to their effect on any part of the pipeline, meaning that we can both evaluate quantitative metrics as well as qualitative effects on the user interface side. Another benefit of the modular architecture is that we can easily provide a parametrizable, automated client module which simulates a user making selections in view space with different presets. That way, we can measure performance metrics across pre-defined benchmark selections. We describe the particular implementation of the steering and computation modules in our paper, including the visual design of ProSteer, an implementation of the client module.
Implementation Details
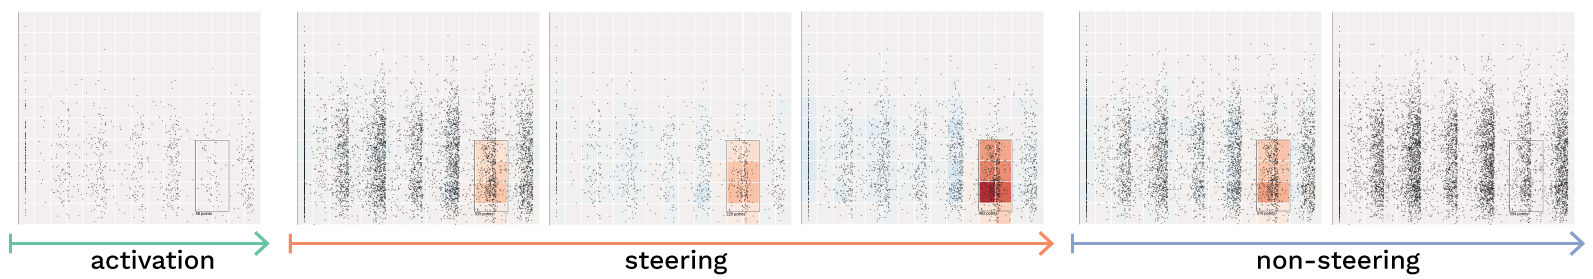
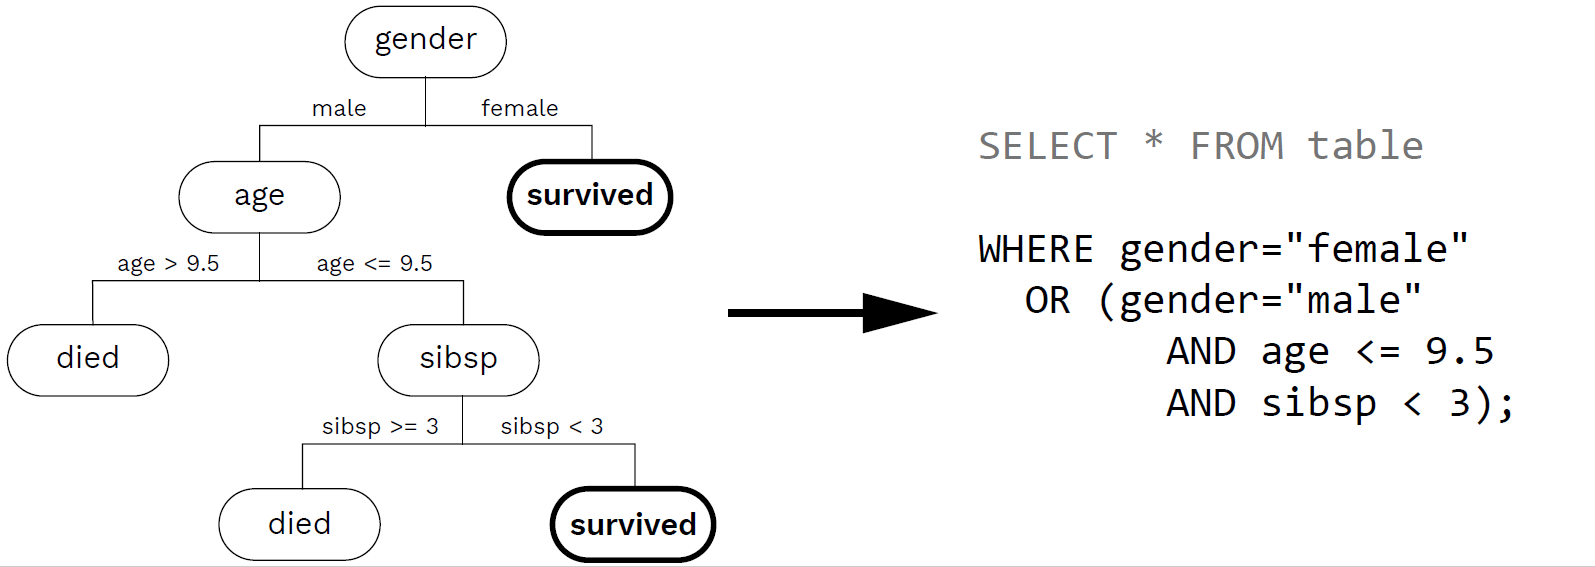
The steering and computation modules use Python 3.8.1, building on functionalities from the DecisionTreeClassifier module of scikit-learn in version 0.22.2 as well as NumPy version 1.18.1 and Pandas version 1.0.1. Scikit-learn's implementation of decision trees is an optimization of the CART algorithm, which includes some performance optimizations such as pruning subtrees that contribute the least to the overall accuracy of the classification in order to avoid overfitting. To overcome unbalanced class cardinalities, we parametrize the decision tree with class weights representing the relative percentages of items from each class in the total training dataset. The steering query extracted from the decision tree is appended to the WHERE clause of the initial user query, seeking for accommodations close to a given conference location and for a certain time interval. For visual comparison, the computation module can optionally also be used in "dual" mode, in which two progressions are run in parallel: One using steering-by-example, the other one using random uniform sampling. Using this mode, client modules can visualize both a steered and a non-steered version of the progression side-by-side.
The user-driven client module is implemented in ProSteer, a web-based interface using TypeScript version 3.3, ReactJS version 16.8.6, and D3 version 5.7.2. Its purpose is to provide a visual interface to the benchmarks, to demonstrate how steering translates into the progressive visualization of the dataset. A detailed description of ProSteer's functionality can be found in our paper.
The automated client module that was used for producing the benchmark results was implemented in Python. Test cases are defined inside a configuration file that describes the region in view space that is to be selected. The automated module loads these test cases and then records the evaluation metrics. These metrics are then output to another file for further analysis.
The communication channel between the client and computation modules is realized using Eel version 0.12.2, which provides a minimalistic, JSON-based bridge between Python and web frameworks. The client module sends lists of IDs of data items that were rendered inside the user selection through that channel, as well as the initial user parameters. Additionally, the client can send messages to control the progression in the computation module, in order to pause, restart, and reset the computation. Since our implementation is designed to assess the performance of steering-by-example instead of being used for productive visual analysis, the pausing functionality in ProSteer does indeed halt the progression rather than "muting" it into a background process that continues as the user investigates the visualization, which is commonly found in PVA tools. The computation module on the other hand sends lists of items that were retrieved from the database through the Eel interface. In keeping the information interchange between the modules to a minimum, the computation module remains isolated from the particular visualization and interaction technique used in the client.
Lastly, the database module uses a MySQL version 8 database. It communicates with the computation module through the mysql-connector-python package.